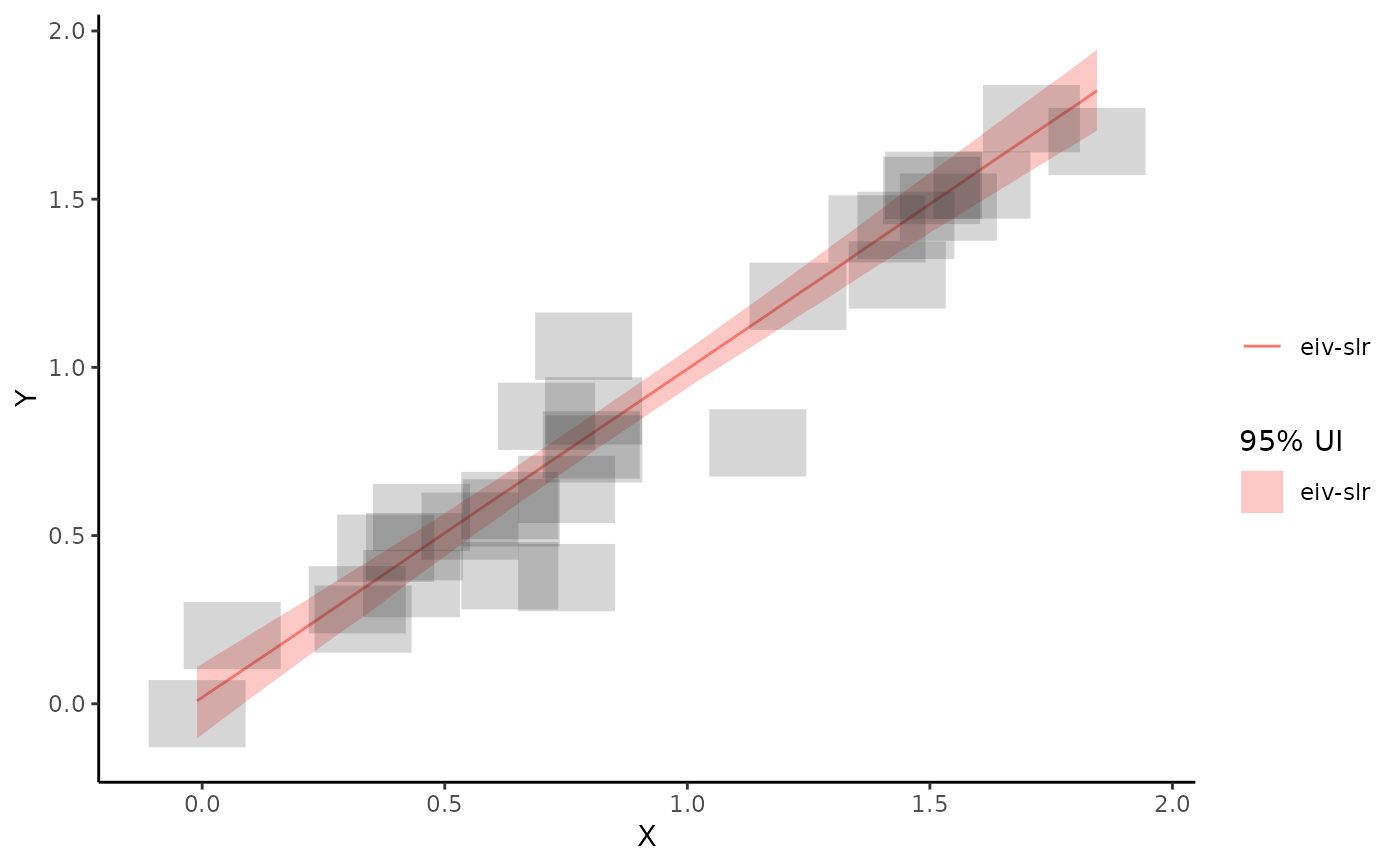
Plot of data plus model estimates (and credible intervals)
plot_res.RdPlot of data plus model estimates (and credible intervals)
Examples
dat <- sim_slr(n_sim = 30)
mod <- run_mod(dat, model = "slr")
#> Compiling model graph
#>    Resolving undeclared variables
#>    Allocating nodes
#> Graph information:
#>    Observed stochastic nodes: 60
#>    Unobserved stochastic nodes: 33
#>    Total graph size: 380
#>
#> Initializing model
#>
#> No convergence issues detected
plot_res(mod)