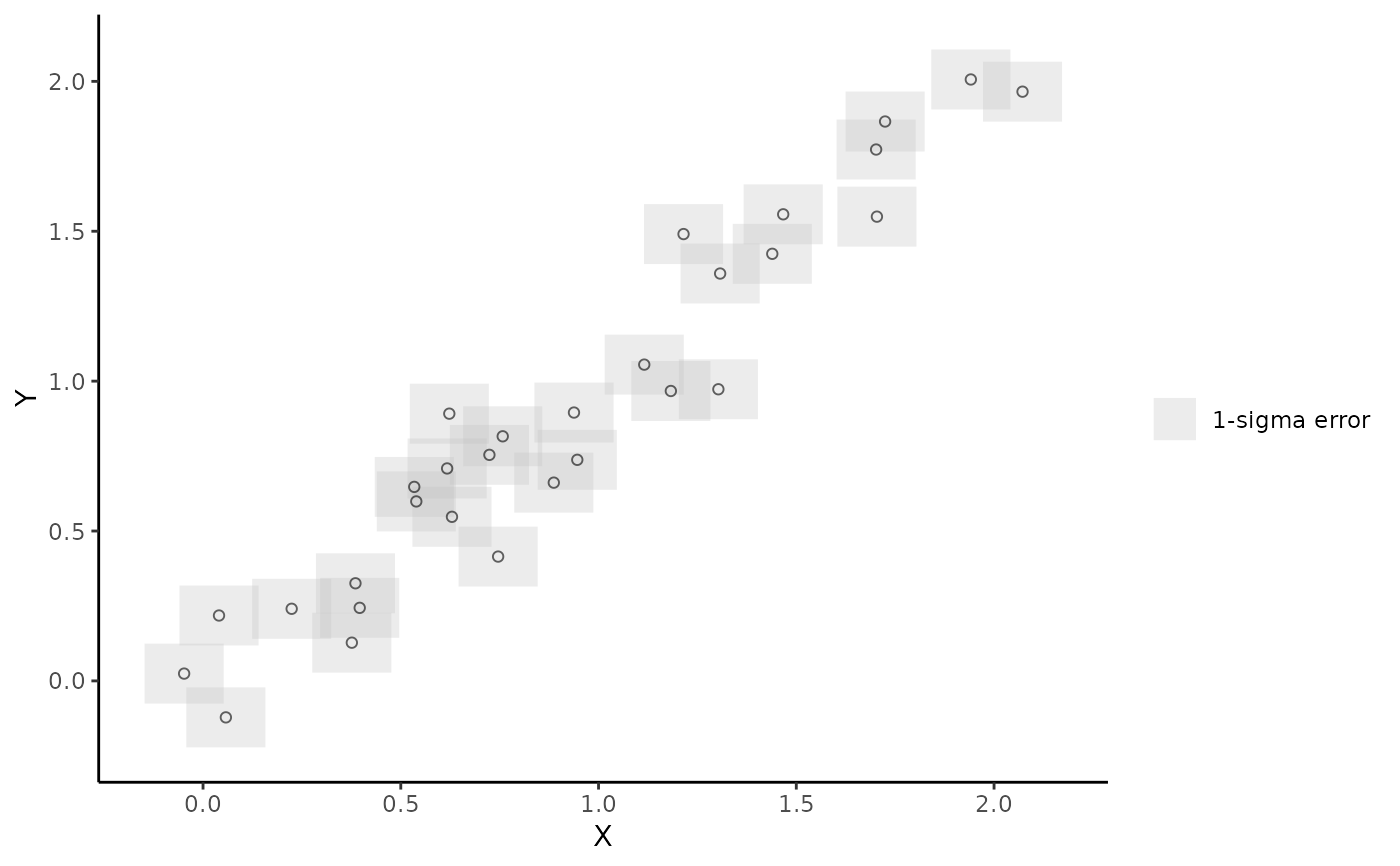
Plot data with measurement uncertainty (in y and x variables)
plot_dat.RdPlot data with measurement uncertainty (in y and x variables)
Arguments
- dat
Input data with columns x,x_err,y,y_err
- BP_scale
Present the data as Before Present (BP). Defaults to FALSE.
- add_truth
Logical argument to add the "True" data generating process to the plot. This should only be set to True when using simulated data from sim_slr, sim_cp or sim_gp.
Examples
dat <- sim_slr(n_sim = 30)
plot_dat(dat)